How it runs
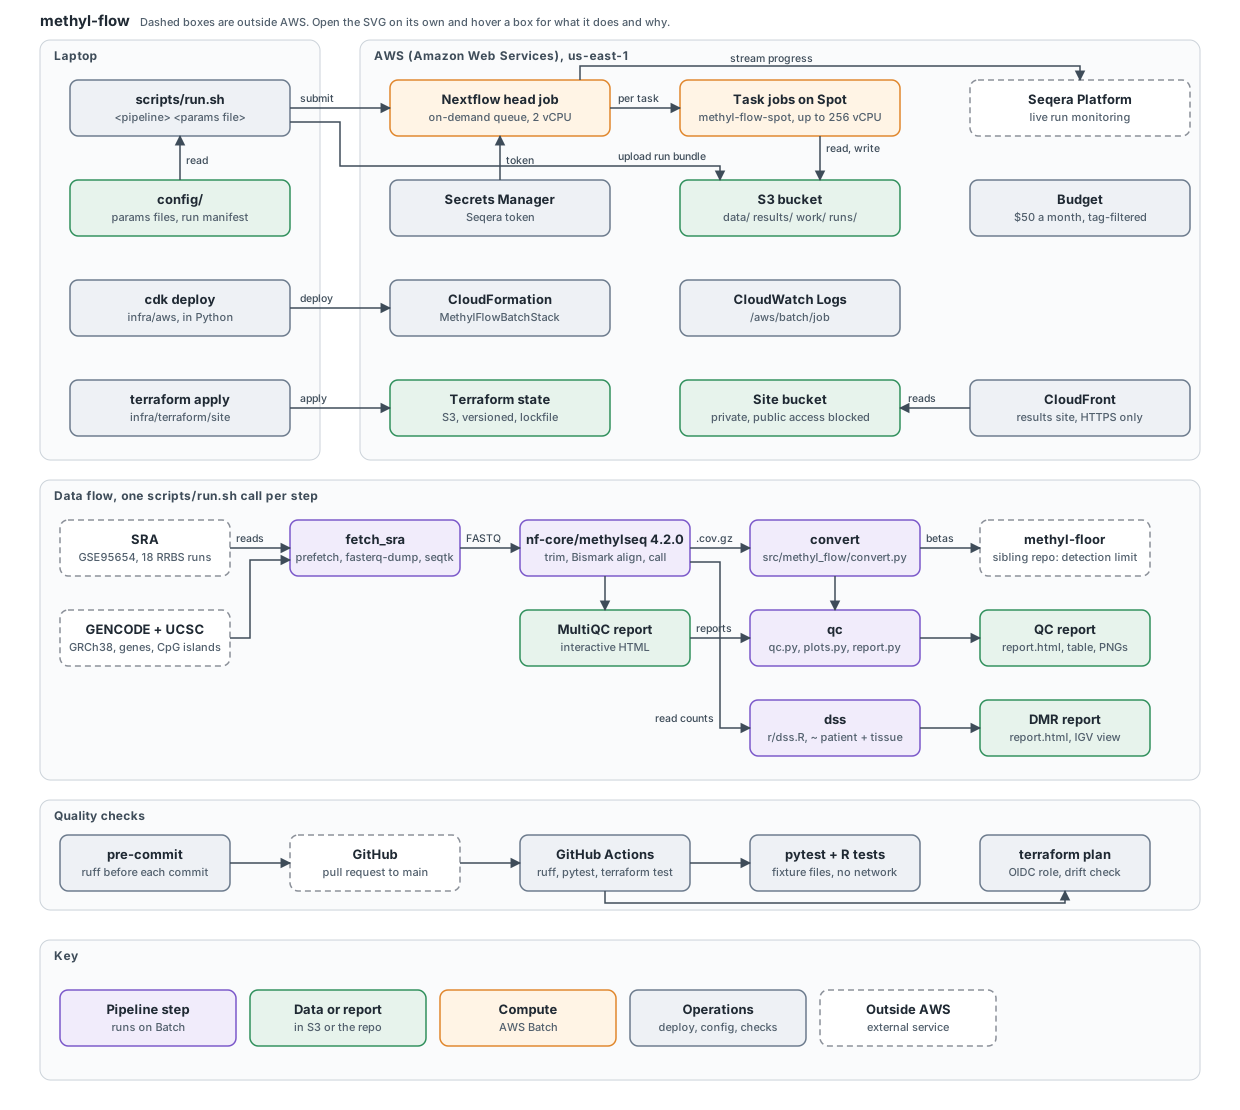
A laptop submits each step with one command, scripts/run.sh, and does no processing. A Nextflow head job on AWS (Amazon Web Services) Batch starts one job per task on Spot capacity, which scales to zero when idle, and every file lives in S3 (Amazon Simple Storage Service). Pipeline and tool versions are pinned, so a run reproduces from its params file. The steps: fetch reads from the SRA (Sequence Read Archive), process them with nf-core/methylseq, convert the methylation calls into a beta table, check quality, test tumor against normal with DSS (Dispersion Shrinkage for Sequencing data), and annotate the results. The infrastructure is code: the CDK (Cloud Development Kit) builds the Batch side, and Terraform builds this site.
Data
GSE95654 (GEO, Gene Expression Omnibus, Series 95654) is public RRBS (reduced representation bisulfite sequencing) of primary colorectal tumors and adjacent normal colon. This analysis uses 9 patients and 18 samples, each downsampled to 20 million read pairs with a fixed seed. Bisulfite treatment turns unmethylated cytosines into uracil, read as thymine, while methylated cytosines stay cytosine; so counting C and T at each CpG (cytosine followed by guanine) site gives its methylation level, the beta value, from 0 to 1.
Quality control
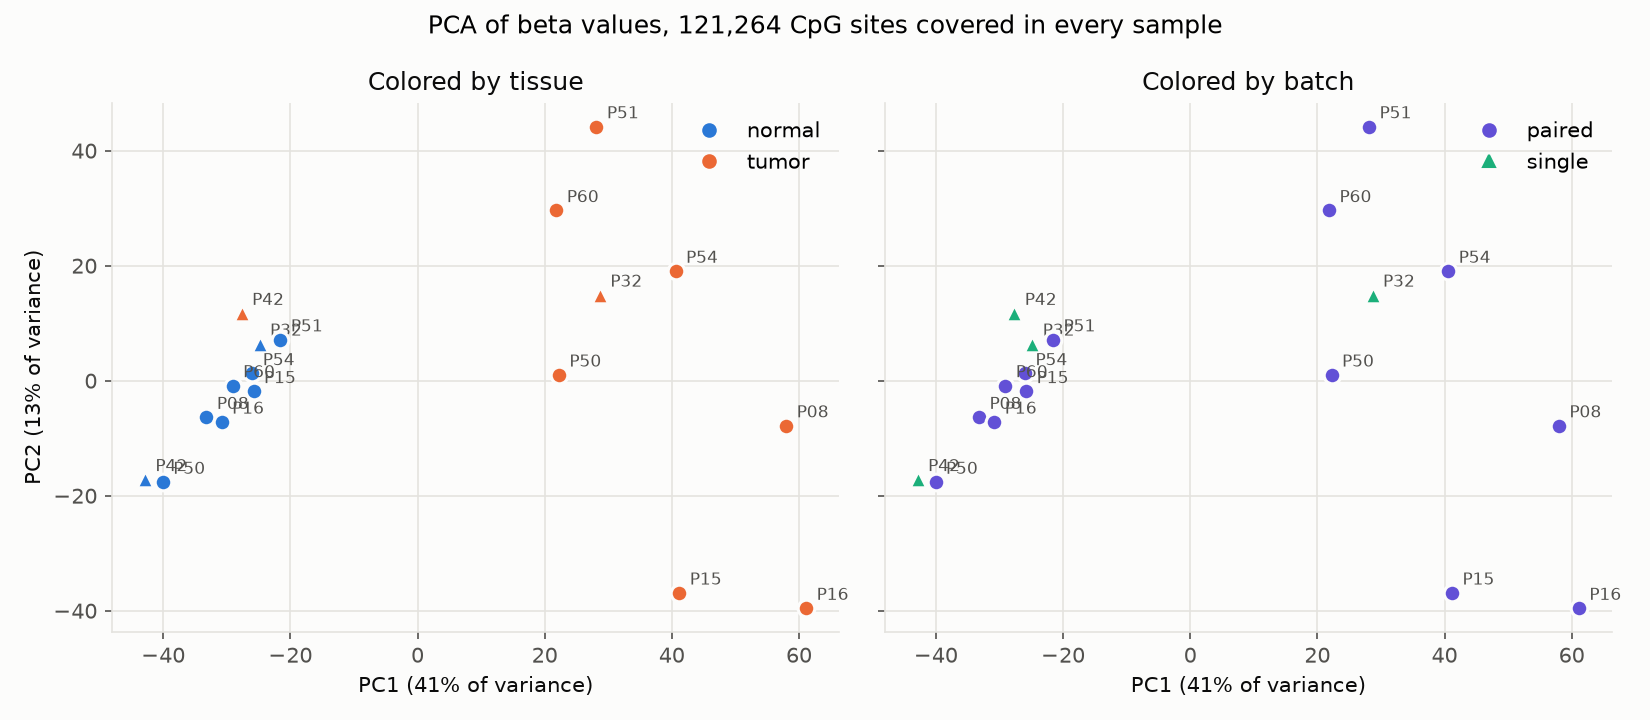
Bisulfite conversion was 99.3% to 99.6% in every sample, above the usual 99% bar, so false methylation from unconverted cytosines stays under 1%. Median coverage was 4 to 7 reads per site, with 18.5% to 33.0% of sites at 10 or more reads. PCA (principal component analysis) separates 8 of 9 tumors from the normals on its first component, and the one batch in the data, single-end against paired-end reads, does not separate samples.
Tumor against normal
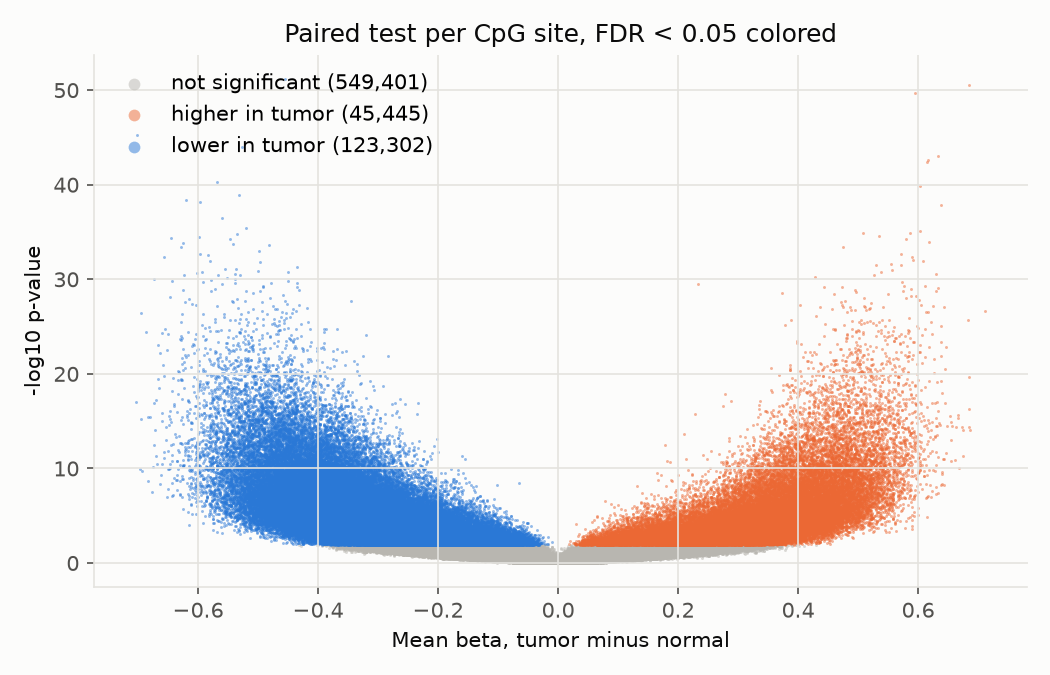
DSS (Dispersion Shrinkage for Sequencing data) fits a beta-binomial model to methylated and total reads at each site and compares each tumor with its own patient's normal. Of 718,148 sites with 5 or more reads in every sample, 168,747 (23.5%) pass FDR (false discovery rate) < 5%: 123,302 lose methylation in tumor and 45,445 gain it. Runs of nearby significant sites form 10,947 DMRs (differentially methylated regions). Before trusting a quarter of sites passing, three checks: significant sites change a lot (median 0.30 in beta), the p-value distribution shows no inflation, and 93.1% of DMRs move the same way in at least 8 of 9 patients.
Where the changes fall
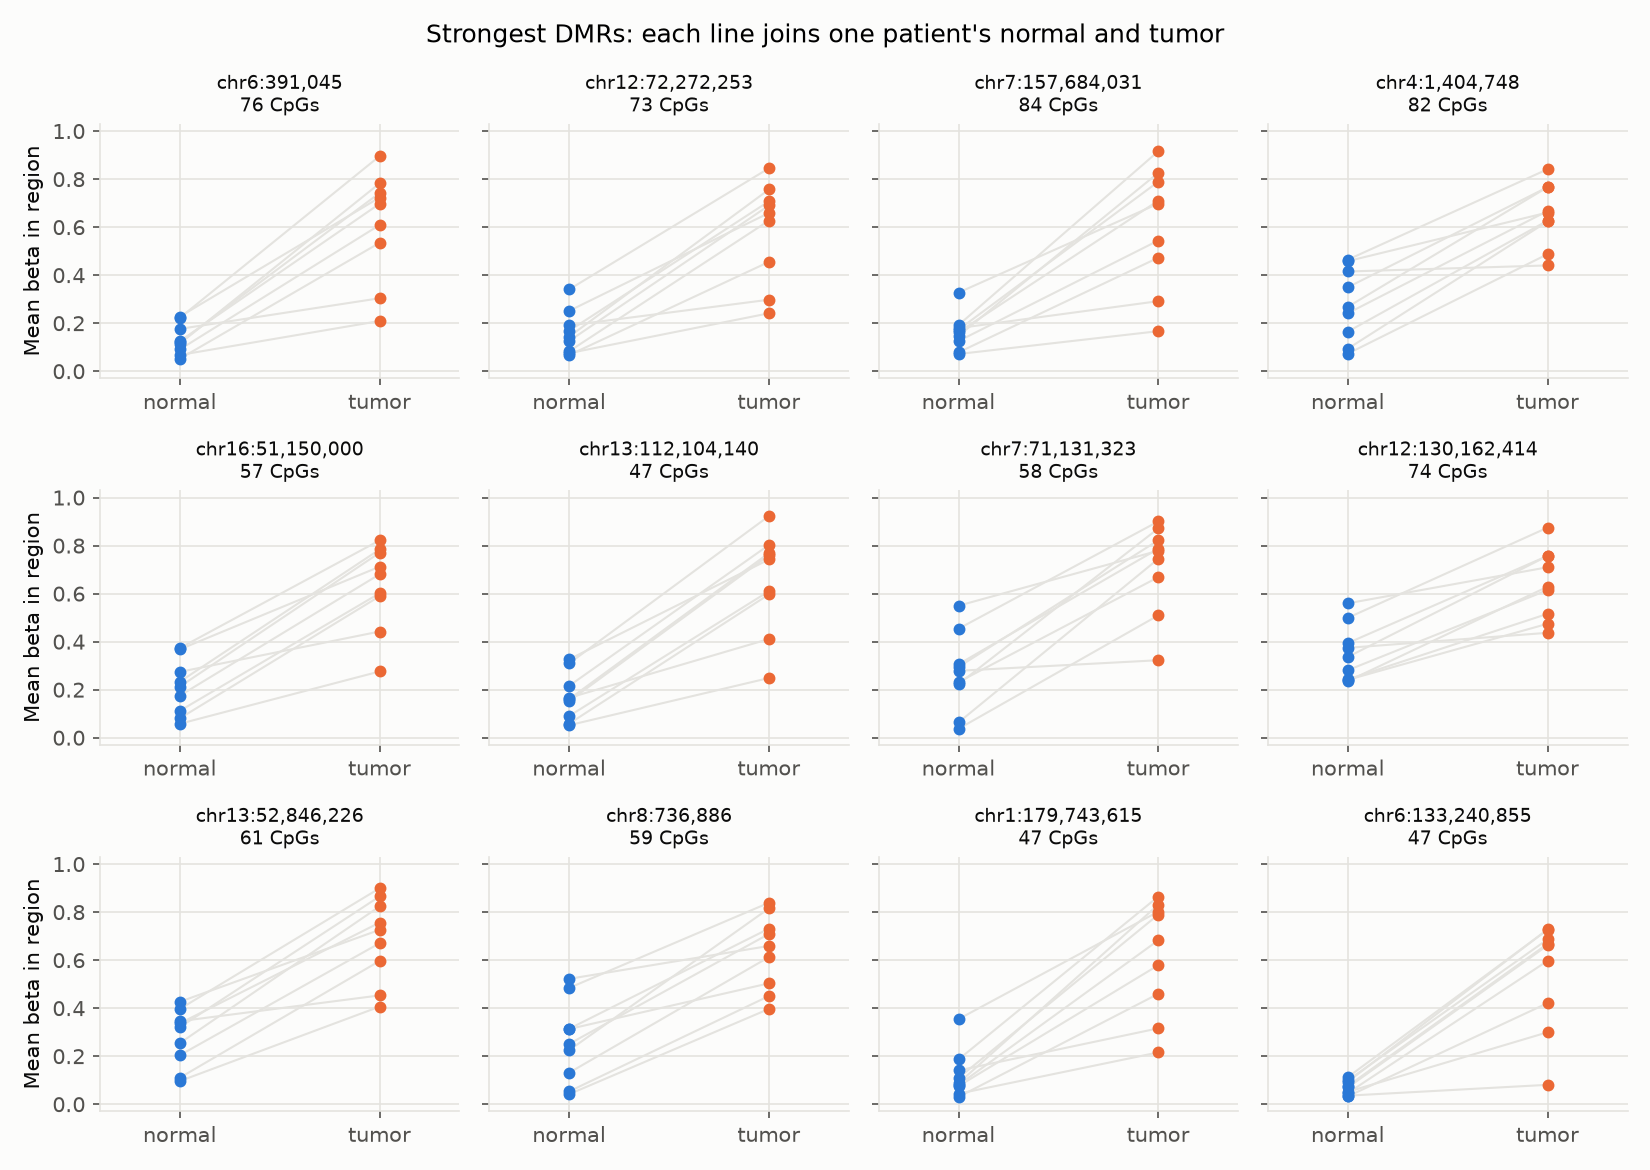
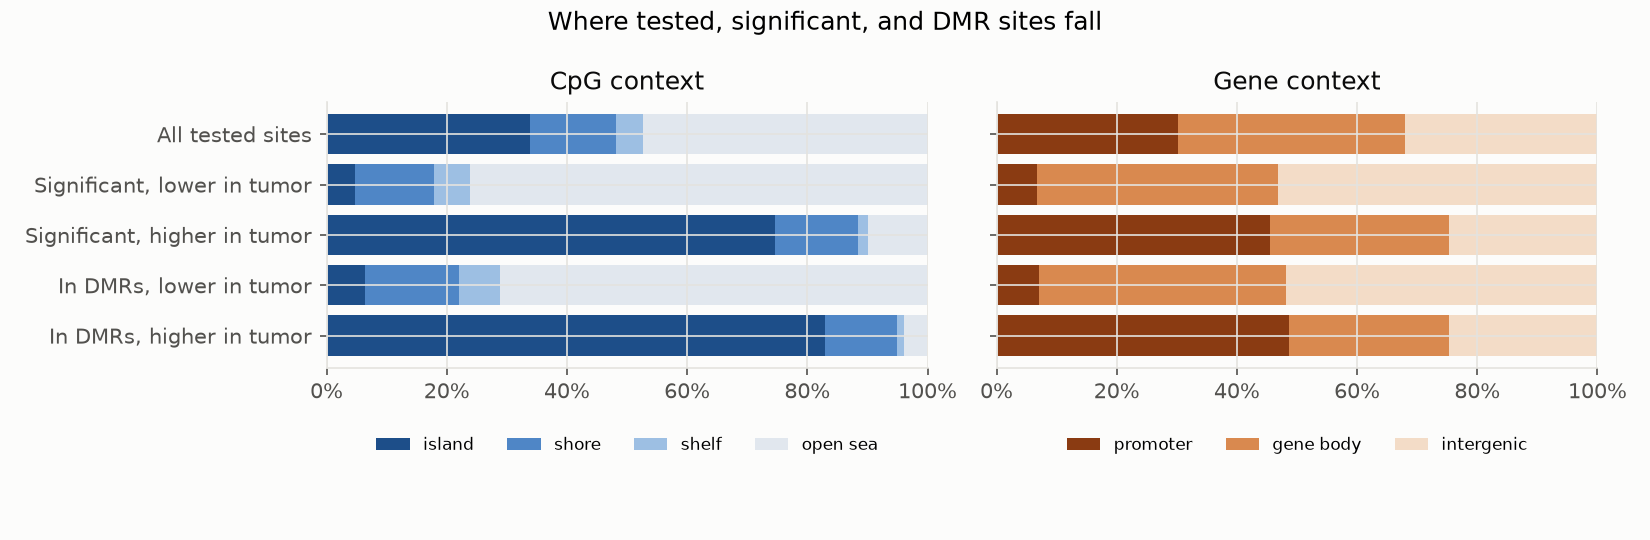
Cancer is expected to gain methylation at CpG (cytosine followed by guanine) islands in promoters, which switches genes off, and to lose it across the rest of the genome. The test knew nothing about islands or genes, so this is an independent check. Sites in DMRs gaining methylation are 82.9% in islands (2.45 times the tested background) and 48.7% in promoters; sites losing it are 71.2% in open sea, away from islands. The strongest regions and their nearest protein-coding genes:
| Region start | Nearest gene | Context | CpG sites | Normal to tumor beta |
|---|---|---|---|---|
| chr6:391,045 | IRF4 | promoter | 76 | 0.13 to 0.61 |
| chr12:72,272,253 | TRHDE | promoter | 73 | 0.16 to 0.59 |
| chr7:157,684,031 | DNAJB6 | island | 84 | 0.16 to 0.60 |
| chr4:1,404,748 | NKX1-1 | promoter | 82 | 0.28 to 0.65 |
| chr16:51,150,000 | SALL1 | promoter | 57 | 0.21 to 0.63 |
| chr13:112,104,140 | SOX1 | island | 47 | 0.17 to 0.65 |
| chr7:71,131,323 | GALNT17 | promoter | 58 | 0.27 to 0.71 |
| chr12:130,162,414 | FZD10 | promoter | 74 | 0.35 to 0.64 |
| chr13:52,846,226 | PCDH8 | promoter | 61 | 0.28 to 0.69 |
| chr8:736,886 | DLGAP2 | promoter | 59 | 0.26 to 0.64 |
A gene name is a position, not a function: no expression data was measured, so a DMR at a promoter suggests, but doesn't show, that the gene is switched off.
Genome browser
An IGV (Integrative Genomics Viewer) view of the 25 strongest DMRs (differentially methylated regions) in each direction: mean methylation in normal and tumor at every tested site, the DMRs, CpG (cytosine followed by guanine) islands, and genes. Pick a region from the table, then zoom out to see 2,000 bases either side.
Run records
Nextflow's execution reports and timelines record every task's run time, CPU, and memory.
Limits
- Downsampled to 20 million read pairs per sample; median coverage is 4 to 7 reads per site.
- 9 patients: enough to show the pipeline and a clear tumor signal, not enough to generalize.
- RRBS (reduced representation bisulfite sequencing) reads CpG-rich regions well and most of the genome not at all.
- Tissue, not blood. MCED (multi-cancer early detection) tests read cell-free DNA, where tumor DNA is a small fraction of the total.